Ranked #43 of 51 by Cost
2026 California Car Insurance Calculator
Estimate your monthly premium based on The Golden State averages

Rate Calculator
Local insurance tip
California is one of the few states that prohibits insurers from using credit scores to price auto policies. Rates are based primarily on driving record, miles driven and years of experience. The most impactful way to lower your premium in California is to accurately report your annual mileage. Low-mileage drivers who underestimate their savings potential by not shopping pay-per-mile options are leaving significant money on the table.
Cost Breakdown
| Coverage | Monthly | Description |
|---|---|---|
| CA minimum | $77 | Legal bare minimum (liability only) |
| Standard liability | $122 | High Liability, no physical damage |
| Full coverage | $163 | Comprehensive ($500 ded.) |
| Premium protection | $222 | Max liability ($250 ded.) |
| Age | Risk | Monthly |
|---|---|---|
| 16-19 | Very high | $481 |
| 20-24 | High | $269 |
| 25-54 | Standard | $163 |
| 55-69 | Low | $155 |
| 70+ | Moderate | $204 |
| Violation | Risk | Monthly |
|---|---|---|
| Clean | Standard | $163 |
| Speeding Ticket | Moderate | $199 |
| At-Fault Accident | High | $241 |
| DUI / DWI | Very high | $465 |
California Snapshot · July 2026
$163/mo
State avg (-33% US AVG)
#43
National Rank
38%
County Spread
Rate by Neighboring States (4)
State Insight
California is cheaper than all of its neighbors despite being the most urbanized. The gap is most striking against Nevada — largely a reflection of how aggressively Proposition 103 suppresses rates compared to states with no equivalent regulation.
Rate by Cities (Top 100)
Compared to CA avg ($163)
City Insight
Los Angeles is the clearest driver of the state's cost, sitting well above the statewide average. Glendale, Van Nuys and North Hollywood stand out as significant outliers — all within the greater LA metro but with rates that far exceed even Los Angeles city itself, reflecting concentrated vehicle theft and dense traffic in those specific corridors.
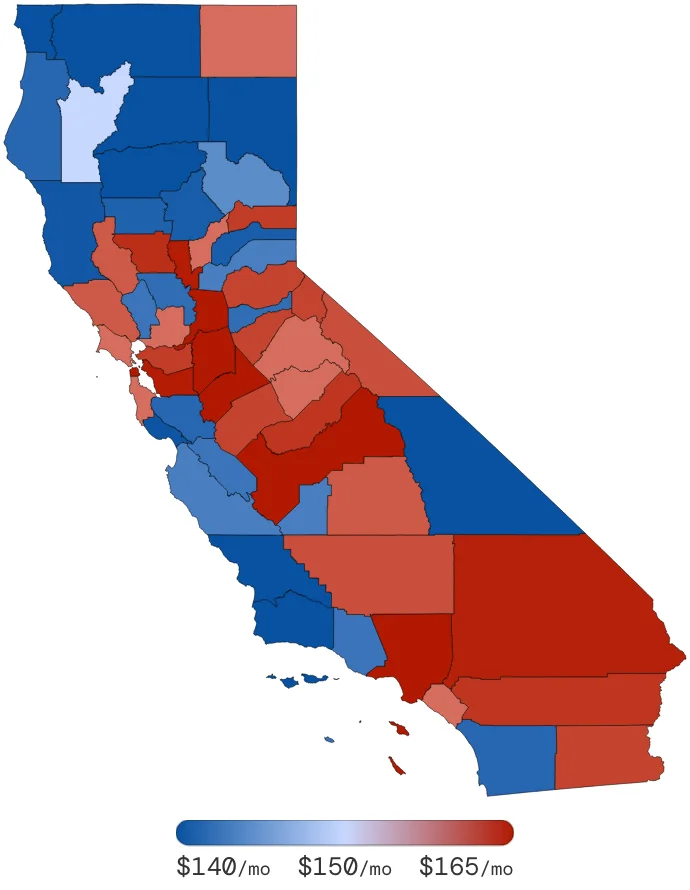
Rate by Counties (58)
Compared to CA avg ($163)
County Insight
Los Angeles County pulls the statewide average upward, but the spread across California's counties is remarkably narrow compared to most states. San Luis Obispo, Santa Barbara and Shasta counties sit at the low end, while no county reaches dramatically above the state average outside LA. Prop 103's rate regulation compresses the county-to-county variation more than almost any other state.
What Every CA Driver Needs To Know
What are the minimum car insurance requirements in CA for 2026?
California raised its minimums on January 1, 2025 for the first time in decades. The new requirements are 30/60/15: $30,000 bodily injury per person, $60,000 per accident and $15,000 for property damage. California is an at-fault state and does not require PIP or Uninsured Motorist coverage, though both must be offered.
Can California insurers use my credit score to set my rate?
No, California is one of a small number of states that explicitly prohibits credit-based insurance scoring. Under Proposition 103, insurers must base rates primarily on driving record, years of driving experience and annual mileage. This means good-credit drivers may not see the same savings they would in other states, but drivers with poor credit are also protected from the surcharges that apply almost everywhere else.
What is the California Low Cost Auto Insurance program?
California operates a state-sponsored Low Cost Auto Insurance program for income-eligible drivers who meet certain requirements. Qualifying drivers can obtain liability-only coverage at significantly reduced rates through the program. Income limits, vehicle value caps and driving record requirements apply. The program is administered through the California DMV and is designed to reduce the state's high uninsured driver rate by making basic coverage accessible to low-income residents.
What are the penalties for driving uninsured in California?
California fines for a first uninsured driving offense range from $100 to $200, but court fees and assessments typically bring the total to $400–$500 or more. Your vehicle may be impounded. A second offense within three years results in fines of $200–$500 plus fees. California also uses an electronic verification system and uninsured drivers involved in accidents can have their vehicles impounded and registration suspended regardless of fault.
Sources: California DMV