#8 of 51 by Cost

2026 Texas Car Insurance Calculator

Estimate your monthly premium based on The Lone Star State averages

Texas state flag — 2026 car insurance rates

Rate Calculator

$287
per month
$3,444
per year
Updated July 1, 2026

Local insurance tip

Texas is one of the few states where insurers are required to offer a Personal Injury Protection (PIP) add-on, which you must affirmatively reject in writing to decline. Keeping the default $2,500 PIP is inexpensive and pays your medical bills and lost wages regardless of fault, making it one of the best-value coverages Texas drivers often unknowingly waive.

Cost Breakdown

Average Monthly Insurance Rate by Coverage Level
CoverageMonthlyDescription
TX minimum$135Legal bare minimum (liability only)
Standard liability$215High Liability, no physical damage
Full coverage$287Comprehensive ($500 ded.)
Premium protection$390Max liability ($250 ded.)
Average Monthly Insurance Rate by Age Group
AgeRiskMonthly
16-19Very high$847
20-24High$474
25-54Standard$287
55-69Low$273
70+Moderate$359
Average Monthly Insurance Rate by Driving History
ViolationRiskMonthly
CleanStandard$287
Speeding TicketModerate$350
At-Fault AccidentHigh$425
DUI / DWIVery high$818

Texas Snapshot · July 2026

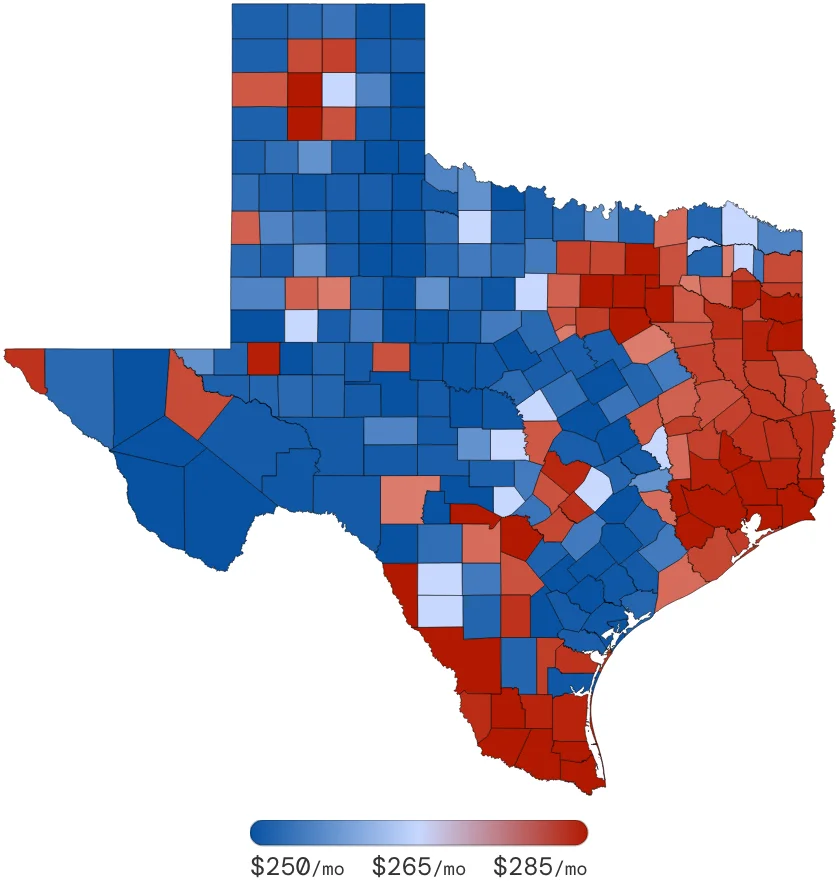
Texas Car Insurance Rates by County July 2026

$287/mo

State avg (+17% US AVG)

#8

National Rank

38%

County Spread

Rate by Neighboring States (5)

Average Monthly Insurance Rate by State
RankStateMonthly Population
1Louisiana$420+46%4,508,066
2Texas$28725,046,020
3Oklahoma$233-19%3,725,119
4Arkansas$219-24%2,907,346
5New Mexico$204-29%2,036,065

State Insight

Texas is the most expensive of its neighbors by a significant margin outside Louisiana. Louisiana is dramatically more expensive, its litigation environment pushing it nearly 50% above Texas. Oklahoma and Arkansas are both meaningfully cheaper. New Mexico is the most affordable neighbor, its lower urban density and medical costs keeping it well below Texas despite sharing a long border.

Rate by Cities (Top 100)

Average Monthly Insurance Rate by City
RankCityMonthly Population
1Dallas$333+16%1,250,874
2Garland$331+15%226,892
3DeSoto$328+14%48,877
4Cedar Hill$322+12%45,373
5Mesquite$315+10%140,703
6Irving$313+9%217,883
7Houston$312+9%2,906,334
8Rowlett$311+8%54,963
9Richardson$310+8%99,347
10Brownsville$309+8%195,686
11Grand Prairie$309+8%174,375
12Mission$309+8%167,182
13Edinburg$309+8%136,507
14Mcallen$309+8%131,628
15Carrollton$309+8%119,595
16Pharr$309+8%70,840
17San Antonio$308+7%1,577,687
18Pasadena$307+7%145,975
19Laredo$306+7%248,210
20Cypress$304+6%122,803
21San Benito$304+6%55,878
22Richmond$302+5%97,598
23Harlingen$302+5%87,263
24Weslaco$302+5%63,844
25Baytown$300+5%103,027
26Humble$299+4%130,866
27Rockwall$298+4%56,131
28Sugar Land$297+3%149,159
29Orange$296+3%49,572
30Tomball$295+3%68,059
31North Richland Hills$294+2%61,653
32Katy$292+2%250,975
33Missouri City$291+1%91,828
34Arlington$290+1%370,281
35Wylie$289+1%48,197
36Spring$287316,665
37Friendswood$28747,636
38Kingwood$28663,634
39Eagle Pass$28653,040
40Waxahachie$28646,402
41Fort Worth$285-1%808,032
42Amarillo$284-1%218,766
43Beaumont$284-1%142,692
44Mansfield$284-1%61,361
45Mckinney$283-1%144,932
46Grapevine$283-1%46,320
47Burleson$282-2%59,744
48Port Arthur$282-2%53,986
49Plano$281-2%278,067
50Odessa$281-2%137,390
51Euless$281-2%60,449
52Conroe$280-2%130,233
53Pflugerville$280-2%68,789
54Pearland$279-3%112,611
55Allen$279-3%93,487
56Magnolia$279-3%54,225
57Keller$277-3%95,035
58Austin$276-4%939,499
59Lewisville$276-4%109,212
60Bedford$275-4%46,885
61Corpus Christi$274-5%305,739
62El Paso$273-5%738,438
63Tyler$273-5%144,160
64Lufkin$273-5%63,040
65Frisco$272-5%120,276
66Nacogdoches$272-5%52,598
67San Marcos$271-6%63,836
68Galveston$271-6%49,659
69The Colony$271-6%47,852
70League City$270-6%71,580
71Longview$269-6%102,348
72Huntsville$269-6%63,487
73Texas City$268-7%43,505
74Granbury$267-7%47,119
75Kyle$267-7%42,954
76Bryan$264-8%89,322
77Weatherford$263-8%65,228
78Texarkana$262-9%60,677
79Alvin$261-9%46,627
80College Station$260-9%105,109
81Flower Mound$260-9%64,771
82Leander$260-9%54,068
83Seguin$259-10%45,341
84Lubbock$258-10%248,257
85Cleburne$257-10%42,578
86Round Rock$255-11%139,523
87Cedar Park$255-11%65,099
88Denton$254-11%139,552
89New Braunfels$254-11%78,685
90Sherman$254-11%46,563
91Del Rio$252-12%48,149
92Victoria$251-13%80,531
93Waco$250-13%146,904
94Midland$246-14%134,281
95Killeen$246-14%134,151
96Abilene$244-15%123,875
97Georgetown$242-16%69,072
98Wichita Falls$239-17%102,011
99Temple$238-17%72,710
100San Angelo$236-18%103,927

Compared to TX avg ($287)

City Insight

Dallas leads the major Texas cities. Its combination of vehicle theft, hail exposure and active litigation in Dallas County pushing it above Houston despite Houston's storm reputation. The Rio Grande Valley cities (McAllen, Edinburg, Mission and Brownsville), form a distinct high-rate cluster driven by high uninsured driver concentrations and cross-border traffic exposure along the Mexico corridor.

Rate by Counties (254)

Average Monthly Insurance Rate by County
RankCountyMonthly Population
1Dallas$326+14%2,410,325
2Harris$308+7%4,117,183
3Hidalgo$308+7%773,798
4Bexar$307+7%1,695,333
5Webb$306+7%249,532
6Cameron$306+7%406,162
7Waller$302+5%38,435
8Rockwall$297+3%78,537
9Chambers$297+3%31,475
10Fort Bend$296+3%539,048
11Starr$296+3%61,163
12Liberty$295+3%72,571
13Willacy$295+3%21,997
14Kaufman$294+2%97,881
15Orange$294+2%84,826
16San Jacinto$28731,426
17Bandera$28720,163
18Tarrant$2861,747,697
19Maverick$28654,258
20Ellis$285-1%157,209
21Harrison$285-1%53,092
22Jim Hogg$285-1%5,350
23Potter$285-1%119,575
24Panola$284-1%22,904
25Jefferson$284-1%251,163
26Randall$284-1%119,591
27Collin$283-1%728,135
28Upshur$281-2%35,507
29Montgomery$281-2%446,351
30Ector$281-2%139,875
31Rusk$280-2%44,405
32Hardin$280-2%55,197
33Brooks$279-3%7,514
34Kenedy$279-3%277
35Travis$278-3%1,008,116
36Smith$276-4%213,182
37Jasper$276-4%35,289
38Zapata$276-4%13,528
39Newton$275-4%10,568
40Tyler$275-4%21,145
41Caldwell$275-4%37,497
42Polk$274-5%45,118
43McMullen$274-5%505
44Nueces$274-5%338,489
45El Paso$274-5%789,678
46Angelina$273-5%87,073
47Galveston$272-5%310,523
48Camp$271-6%14,196
49Marion$271-6%10,834
50Nacogdoches$271-6%62,491
51Madison$271-6%13,125
52Sabine$271-6%10,993
53Johnson$271-6%164,248
54Jim Wells$271-6%41,439
55Cherokee$270-6%43,689
56Anderson$270-6%60,372
57Trinity$270-6%14,616
58San Augustine$270-6%8,219
59Wise$270-6%56,480
60Walker$270-6%68,480
61Hutchinson$270-6%22,708
62Denton$269-6%715,299
63Gregg$269-6%147,172
64Shelby$269-6%26,389
65Brazoria$269-6%327,935
66Guadalupe$269-6%113,637
67Cass$268-7%28,559
68Moore$268-7%21,705
69Reeves$268-7%13,783
70Henderson$267-7%85,115
71Hunt$267-7%77,824
72Houston$267-7%24,714
73Hood$267-7%52,738
74Coke$267-7%3,104
75Atascosa$267-7%45,949
76Hays$267-7%172,368
77Armstrong$267-7%1,782
78Van Zandt$266-7%49,754
79Robertson$266-7%15,758
80Burnet$266-7%35,916
81Oldham$266-7%2,674
82Wood$265-8%46,163
83Leon$265-8%19,634
84Parker$265-8%103,940
85Cochran$265-8%3,149
86Dawson$265-8%13,535
87Fannin$264-8%33,262
88Grimes$264-8%28,735
89Matagorda$264-8%36,891
90Austin$264-8%29,441
91Medina$264-8%41,930
92Navarro$263-8%47,014
93Rains$263-8%9,898
94Franklin$263-8%8,168
95Somervell$263-8%8,413
96Edwards$263-8%1,940
97Borden$263-8%275
98Red River$262-9%13,025
99Delta$262-9%4,966
100Titus$262-9%31,470
101Palo Pinto$262-9%29,780
102Baylor$262-9%3,820
103Lampasas$262-9%21,049
104Brazos$262-9%194,431
105Kendall$262-9%35,130
106Bastrop$262-9%75,047
107Llano$262-9%22,091
108Dimmit$262-9%9,834
109Zavala$262-9%11,690
110Carson$262-9%5,731
111Martin$262-9%5,024
112Cooke$261-9%35,326
113Wilbarger$261-9%13,410
114Mason$261-9%3,898
115Washington$261-9%33,822
116Swisher$261-9%8,373
117Lynn$261-9%5,896
118Jones$261-9%12,935
119Loving$261-9%80
120Bowie$260-9%92,125
121Schleicher$260-9%3,377
122Gray$260-9%22,640
123Hardeman$260-9%4,178
124Hockley$260-9%21,935
125Gaines$260-9%16,825
126Morris$259-10%13,751
127Freestone$259-10%18,052
128Jack$259-10%8,586
129Eastland$259-10%19,532
130Throckmorton$259-10%1,522
131Wharton$259-10%40,509
132Frio$259-10%17,506
133Gonzales$259-10%20,003
134Blanco$259-10%9,700
135Mitchell$259-10%9,432
136Falls$258-10%15,524
137Comal$258-10%125,814
138Hansford$258-10%5,969
139Lubbock$258-10%272,877
140Knox$257-10%3,541
141Coryell$257-10%55,551
142Uvalde$257-10%26,532
143Castro$257-10%7,396
144Bailey$257-10%7,518
145Young$256-11%18,815
146Erath$256-11%36,118
147Mills$256-11%4,691
148Sherman$256-11%2,366
149Yoakum$256-11%8,596
150Upton$256-11%3,353
151Hudspeth$256-11%3,325
152Grayson$255-11%124,346
153Lamar$255-11%49,495
154Hopkins$255-11%34,115
155Montague$255-11%20,919
156Haskell$255-11%5,805
157Shackelford$255-11%3,038
158Limestone$255-11%22,807
159Reagan$255-11%3,390
160Lee$255-11%16,227
161Calhoun$255-11%21,349
162LaSalle$255-11%6,842
163Duval$255-11%12,620
164Crane$255-11%4,193
165Glasscock$255-11%963
166Winkler$255-11%7,099
167Clay$254-11%7,464
168Archer$254-11%6,571
169Colorado$254-11%21,451
170Wilson$254-11%38,625
171Gillespie$254-11%25,074
172Parmer$254-11%9,931
173Hartley$254-11%1,314
174Dallam$254-11%11,492
175Deaf Smith$254-11%19,473
176Scurry$254-11%17,082
177Ward$254-11%10,629
178Hill$253-12%34,777
179Hamilton$253-12%9,224
180Williamson$253-12%434,395
181Bosque$253-12%19,002
182Kimble$253-12%4,345
183San Patricio$253-12%69,433
184Hemphill$253-12%3,771
185Lamb$253-12%13,997
186Roberts$253-12%837
187Motley$253-12%1,149
188Floyd$253-12%6,313
189Briscoe$253-12%1,638
190Terry$253-12%12,607
191Garza$253-12%6,477
192Howard$253-12%35,361
193Callahan$252-12%12,762
194Concho$252-12%4,009
195Menard$252-12%2,060
196Irion$252-12%1,504
197Crockett$252-12%3,693
198Sutton$252-12%4,180
199Sterling$252-12%1,143
200Burleson$252-12%17,041
201Jackson$252-12%12,833
202Bee$252-12%30,923
203Val Verde$252-12%48,430
204Donley$252-12%3,666
205Foard$252-12%1,406
206Crosby$252-12%5,923
207Pecos$252-12%15,569
208Stephens$251-13%9,250
209Brown$251-13%38,106
210San Saba$251-13%5,901
211Victoria$251-13%87,546
212Refugio$251-13%7,475
213Kleberg$251-13%32,048
214Hale$251-13%37,291
215Ochiltree$251-13%10,028
216Terrell$251-13%927
217Coleman$250-13%8,904
218DeWitt$250-13%16,219
219Lavaca$250-13%23,452
220Aransas$250-13%20,073
221Lipscomb$250-13%3,329
222Dickens$250-13%2,600
223Comanche$249-13%12,475
224Karnes$249-13%16,373
225Kinney$249-13%3,598
226Wheeler$249-13%5,589
227Collingsworth$249-13%2,889
228Childress$249-13%7,088
229King$249-13%262
230Hall$249-13%3,214
231Cottle$249-13%1,493
232Stonewall$249-13%1,439
233Nolan$249-13%15,807
234Kent$249-13%743
235Fisher$249-13%3,510
236Real$248-14%3,351
237Fayette$248-14%24,660
238Culberson$248-14%2,336
239Milam$247-14%24,242
240McLennan$247-14%236,812
241Runnels$247-14%11,065
242Kerr$247-14%48,654
243McCulloch$246-14%8,400
244Goliad$246-14%5,967
245Live Oak$246-14%8,998
246Midland$246-14%134,281
247Andrews$246-14%14,786
248Jeff Davis$246-14%2,350
249Taylor$245-15%137,201
250Bell$243-15%321,262
251Brewster$242-16%8,979
252Presidio$240-16%7,641
253Wichita$239-17%129,828
254Tom Green$236-18%107,190

Compared to TX avg ($287)

County Insight

Dallas County leads the state, with Harris County and Hidalgo and Cameron counties in the Rio Grande Valley close behind. The Valley counties stand out, their elevated rates relative to population size reflect high uninsured driver exposure and cross-border claim complexity. The far West Texas counties like Brewster and Presidio are the most affordable, their sparse populations and minimal traffic keeping rates well below the rest of the state.

What Every Texas Driver Needs To Know

What are the minimum car insurance requirements in TX for 2026?

Texas requires 30/60/25 minimums: $30,000 bodily injury per person, $60,000 per accident and $25,000 for property damage. Texas is an at-fault state. Insurers are also required to offer Personal Injury Protection (PIP) of at least $2,500, which you must reject in writing if you do not want it.

Does Texas require Uninsured Motorist coverage?

Texas does not mandate UM/UIM coverage, but insurers must offer it and you must sign a written waiver to decline. Texas has a high uninsured driver rate — estimated around 20% — and is a large state where rural accidents can occur far from witnesses or immediate help. UM coverage is particularly valuable on long stretches of rural highway where at-fault drivers may flee the scene.

How does hail and weather affect Texas auto insurance premiums?

Texas sits in one of the most active hail corridors in North America and comprehensive claims from hail damage are a major cost driver for Texas insurers, particularly in the Dallas-Fort Worth Metroplex and along the I-35 corridor. If you drop comprehensive coverage to save money, a single hail storm can result in thousands of dollars in out-of-pocket repair costs. Comprehensive is strongly recommended anywhere in the state.

What are the penalties for driving uninsured in Texas?

Texas fines for a first uninsured driving offense range from $175 to $350, rising to $350–$1,000 for subsequent offenses. Your vehicle can also be impounded. Texas operates a TexasSure insurance verification system that law enforcement and the DMV use to confirm coverage in real time. A surcharge of $250 per year for three years is also added to your license fee after an uninsured conviction.

Sources: Texas DPS