#45 of 51 by Cost

2026 North Carolina Car Insurance Calculator

Estimate your monthly premium based on The Tar Heel State averages

North Carolina state flag — 2026 car insurance rates

Rate Calculator

$154
per month
$1,848
per year
Updated July 1, 2026

Local insurance tip

North Carolina uses a unique 'Safe Driver Incentive Plan' (SDIP). Even a single at-fault accident or minor conviction can add points that raise your rate for up to three years, keeping a clean driving record is the single most impactful way to keep premiums low.

Cost Breakdown

Average Monthly Insurance Rate by Coverage Level
CoverageMonthlyDescription
NC minimum$72Legal bare minimum (liability only)
Standard liability$116High Liability, no physical damage
Full coverage$154Comprehensive ($500 ded.)
Premium protection$209Max liability ($250 ded.)
Average Monthly Insurance Rate by Age Group
AgeRiskMonthly
16-19Very high$454
20-24High$254
25-54Standard$154
55-69Low$146
70+Moderate$193
Average Monthly Insurance Rate by Driving History
ViolationRiskMonthly
CleanStandard$154
Speeding TicketModerate$188
At-Fault AccidentHigh$228
DUI / DWIVery high$439

North Carolina Snapshot · July 2026

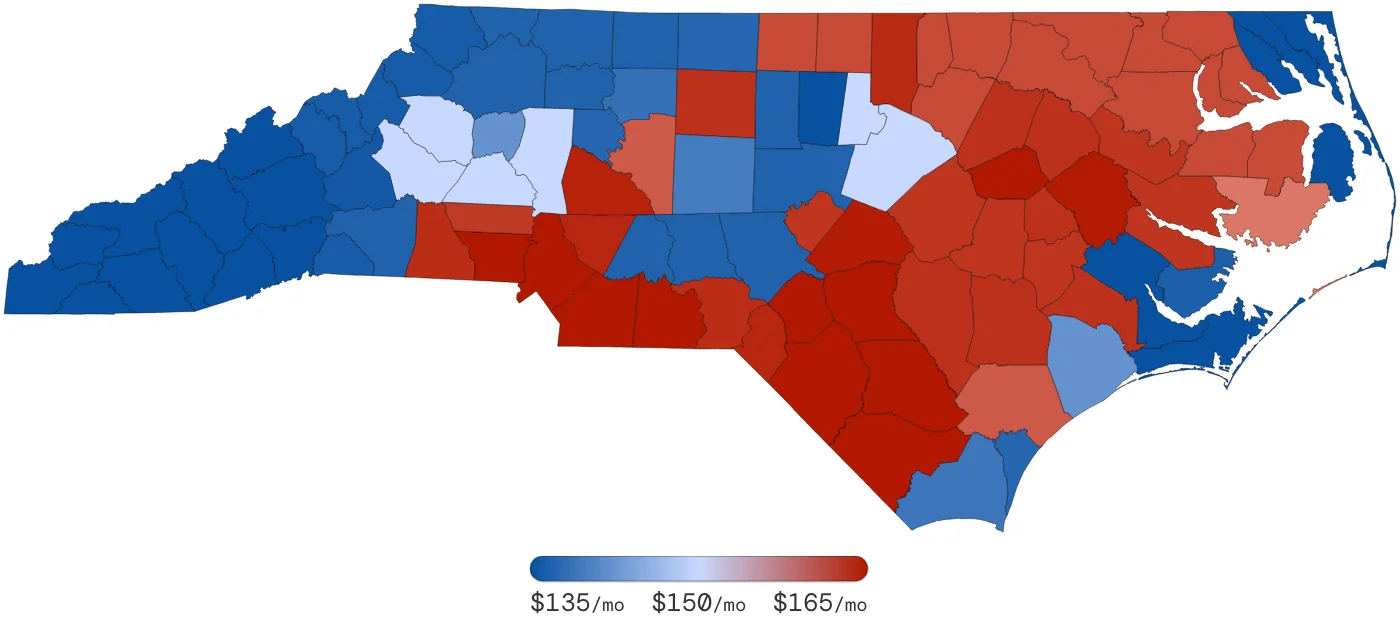
North Carolina Car Insurance Rates by County July 2026

$154/mo

State avg (-37% US AVG)

#45

National Rank

46%

County Spread

Rate by Neighboring States (5)

Average Monthly Insurance Rate by State
RankStateMonthly Population
1Georgia$285+85%9,626,779
2South Carolina$207+34%4,580,680
3Tennessee$199+29%6,326,762
4Virginia$175+14%7,948,284
5North Carolina$1549,471,530

State Insight

North Carolina is the most affordable of its neighbors by a wide margin. Georgia is more than double North Carolina's average despite similar geography, Atlanta's nuclear verdict environment drives a gap that North Carolina's SDIP point system and reinsurance facility actively prevent from developing locally. Virginia and Tennessee are both meaningfully more expensive despite being considered affordable states regionally.

Rate by Cities (Top 50)

Average Monthly Insurance Rate by City
RankCityMonthly Population
1Fayetteville$183+19%238,602
2Charlotte$181+18%790,679
3Gastonia$181+18%102,620
4Lumberton$177+15%53,001
5Monroe$175+14%76,676
6Wilson$171+11%59,853
7Greenville$166+8%108,695
8Greensboro$162+5%305,168
9Concord$162+5%104,595
10Salisbury$162+5%77,045
11Matthews$162+5%67,626
12Kannapolis$162+5%49,010
13High Point$161+5%116,061
14Shelby$159+3%52,833
15Lincolnton$159+3%38,570
16Rocky Mount$158+3%72,025
17Goldsboro$157+2%71,481
18Sanford$157+2%68,183
19Clayton$157+2%54,573
20Garner$157+2%42,128
21Kinston$157+2%42,031
22Fuquay Varina$157+2%38,894
23Waxhaw$155+1%45,097
24Jacksonville$153-1%91,948
25Henderson$153-1%41,608
26Raleigh$152-1%489,514
27Lexington$151-2%76,998
28Thomasville$151-2%46,084
29Durham$148-4%256,789
30Hickory$148-4%79,007
31Mooresville$148-4%69,793
32Statesville$148-4%69,129
33Morganton$148-4%54,996
34Huntersville$148-4%52,133
35Lenoir$148-4%47,703
36Winston Salem$144-6%246,278
37Wilmington$141-8%186,140
38Wake Forest$141-8%53,078
39Kernersville$141-8%51,136
40Burlington$140-9%75,761
41Asheboro$140-9%54,324
42Reidsville$140-9%39,351
43Mount Airy$140-9%38,374
44Cary$135-12%131,592
45Apex$135-12%59,075
46Asheville$134-13%120,389
47Hendersonville$134-13%66,646
48Elizabeth City$130-16%40,699
49Chapel Hill$129-16%91,595
50New Bern$128-17%65,097

Compared to NC avg ($154)

City Insight

Fayetteville and Charlotte lead the state, Fayetteville driven by Cumberland County's high uninsured driver rate and military transient population, Charlotte by Mecklenburg's urban density and traffic volume.

Rate by Counties (100)

Average Monthly Insurance Rate by County
RankCountyMonthly Population
1Hoke$185+20%37,991
2Cumberland$182+18%240,201
3Mecklenburg$177+15%930,895
4Bladen$177+15%83,502
5Gaston$175+14%208,789
6Robeson$175+14%132,821
7Wilson$168+9%80,133
8Union$167+8%200,711
9Anson$166+8%27,004
10Columbus$166+8%58,348
11Pitt$165+7%170,870
12Harnett$164+6%101,512
13Rowan$162+5%121,636
14Cabarrus$161+5%182,792
15Scotland$161+5%34,817
16Granville$160+4%53,024
17Cleveland$159+3%95,434
18Richmond$159+3%46,859
19Guilford$158+3%489,379
20Nash$158+3%103,742
21Edgecombe$158+3%51,478
22Greene$158+3%17,392
23Sampson$158+3%83,817
24Duplin$158+3%58,898
25Jones$158+3%6,118
26Lee$157+2%68,183
27Johnston$157+2%138,634
28Wayne$157+2%123,308
29Beaufort$157+2%49,966
30Martin$157+2%24,859
31Lenoir$157+2%59,256
32Lincoln$156+1%77,135
33Caswell$153-1%17,284
34Person$153-1%44,740
35Franklin$153-1%55,122
36Vance$153-1%46,057
37Warren$153-1%18,277
38Hertford$153-1%28,160
39Northampton$153-1%21,960
40Halifax$153-1%58,174
41Bertie$153-1%18,133
42Perquimans$153-1%13,322
43Tyrrell$153-1%4,217
44Gates$153-1%12,377
45Washington$153-1%13,187
46Chowan$153-1%14,744
47Davidson$151-2%137,351
48Pender$151-2%46,922
49Hyde$149-3%5,304
50Wake$148-4%950,180
51Durham$148-4%260,260
52Iredell$148-4%156,727
53Catawba$148-4%163,496
54Caldwell$148-4%81,490
55Burke$148-4%81,030
56Onslow$147-5%150,523
57Alexander$147-5%36,658
58Randolph$145-6%147,199
59Brunswick$144-6%107,134
60Forsyth$143-7%368,086
61Davie$141-8%40,829
62Rockingham$141-8%99,456
63New Hanover$141-8%204,364
64Surry$140-9%77,263
65Yadkin$140-9%39,518
66Stokes$140-9%48,738
67Chatham$140-9%48,028
68Montgomery$140-9%25,375
69Alamance$140-9%157,690
70Moore$140-9%85,934
71Stanly$140-9%62,459
72Rutherford$140-9%71,652
73Wilkes$140-9%63,894
74Alleghany$140-9%11,834
75Pamlico$139-10%10,918
76Watauga$138-10%53,459
77Ashe$138-10%27,313
78Avery$138-10%12,508
79Mitchell$138-10%17,353
80Yancey$138-10%18,117
81Polk$138-10%20,837
82McDowell$137-11%45,273
83Buncombe$134-13%233,707
84Graham$134-13%8,924
85Jackson$134-13%44,788
86Transylvania$134-13%33,179
87Swain$134-13%8,686
88Haywood$134-13%59,059
89Henderson$134-13%110,105
90Macon$134-13%34,197
91Madison$134-13%21,474
92Cherokee$134-13%26,958
93Clay$134-13%10,936
94Craven$133-14%103,124
95Orange$131-15%137,010
96Pasquotank$130-16%40,699
97Dare$130-16%33,920
98Currituck$130-16%23,950
99Camden$130-16%9,539
100Carteret$127-18%70,845

Compared to NC avg ($154)

County Insight

The mountain counties in western North Carolina are uniformly the most affordable in the state, with Carteret on the coast similarly cheap. Hoke and Cumberland counties in the south-central region lead the state, their military base proximity and higher uninsured driver exposure pushing rates well above the Triangle and Charlotte metros.

What Every North Carolina Driver Needs To Know

What are the minimum car insurance requirements in NC for 2026?

North Carolina requires 30/60/25 minimums: $30,000 bodily injury per person, $60,000 per accident and $25,000 for property damage. You must also carry Uninsured Motorist coverage at matching limits.

What is the NC Safe Driver Incentive Plan (SDIP) and how does it affect my rate?

The SDIP is a state-mandated point system used by all NC insurers to price your policy. At-fault accidents and moving violations add points, which translate directly into a percentage surcharge on your premium for three years. A single minor at-fault accident can raise your rate by 45% or more, making defensive driving one of the best financial decisions you can make.

Can my insurer drop me after a claim in North Carolina?

North Carolina operates a reinsurance 'shared market' called the NC Reinsurance Facility. Insurers cannot simply refuse to cover high-risk drivers — instead, they may cede those policies to the Facility. This means you cannot be left without coverage, though your premium will reflect your risk tier.

Does North Carolina require Uninsured Motorist coverage?

Yes. Unlike many states where UM is optional, North Carolina mandates it at limits equal to your liability coverage. This protects you when the at-fault driver has no insurance or flees the scene — a relatively common scenario on rural state roads.

Sources: NC DMV