Ranked #29 of 51 by Cost
2026 Tennessee Car Insurance Calculator
Estimate your monthly premium based on The Volunteer State averages

Rate Calculator
Local insurance tip
Tennessee does not require Personal Injury Protection or Uninsured Motorist coverage. However, adding both is inexpensive relative to the risk, Tennessee has one of the highest uninsured driver rates in the South and medical costs from an accident can far exceed basic liability limits.
Cost Breakdown
| Coverage | Monthly | Description |
|---|---|---|
| TN minimum | $94 | Legal bare minimum (liability only) |
| Standard liability | $149 | High Liability, no physical damage |
| Full coverage | $199 | Comprehensive ($500 ded.) |
| Premium protection | $271 | Max liability ($250 ded.) |
| Age | Risk | Monthly |
|---|---|---|
| 16-19 | Very high | $587 |
| 20-24 | High | $328 |
| 25-54 | Standard | $199 |
| 55-69 | Low | $189 |
| 70+ | Moderate | $249 |
| Violation | Risk | Monthly |
|---|---|---|
| Clean | Standard | $199 |
| Speeding Ticket | Moderate | $243 |
| At-Fault Accident | High | $295 |
| DUI / DWI | Very high | $567 |
Tennessee Snapshot · July 2026
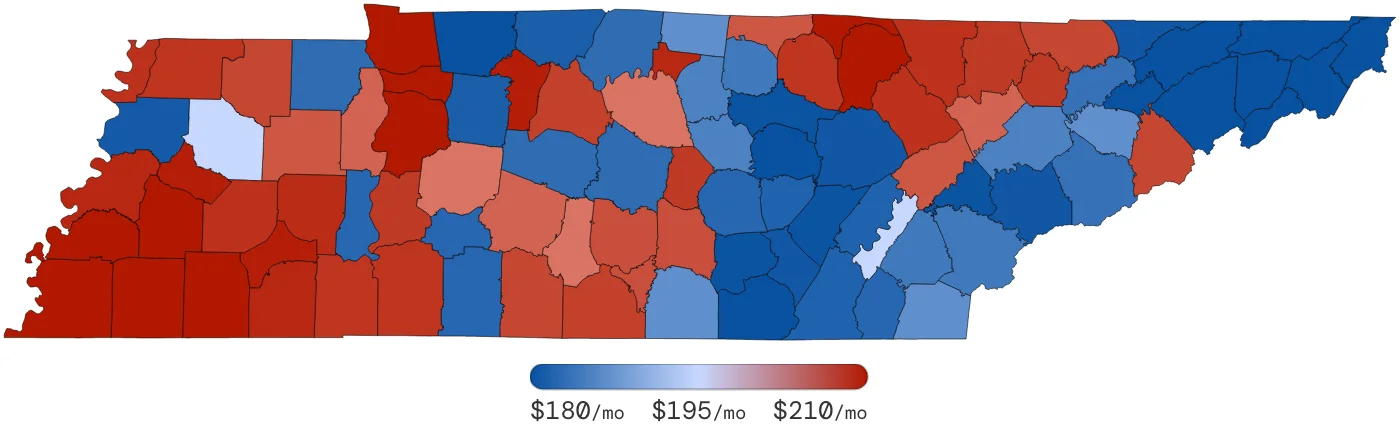
$199/mo
State avg (-19% US AVG)
#29
National Rank
52%
County Spread
Rate by Neighboring States (9)
State Insight
Tennessee sits in the mid-tier among its neighbors. Georgia and Missouri are the most expensive, Atlanta's litigation environment and St. Louis's urban costs both pushing well above Tennessee. Kentucky and Arkansas sit moderately above Tennessee. Virginia, Alabama and North Carolina are all cheaper. North Carolina and Virginia through lower litigation activity, Alabama through its contributory negligence rule that suppresses personal injury claims more aggressively than Tennessee's comparative fault system.
Rate by Cities (Top 30)
Compared to TN avg ($199)
City Insight
Memphis leads the state by a wide margin. Shelby County's vehicle theft rates, high uninsured driver exposure and proximity to Mississippi's border environment push it well above Nashville and every other Tennessee city. Johnson City, Kingsport and Bristol in the far northeast corner are the most affordable. Their Appalachian demographics and lower claim frequency keeping rates well below the rest of the state.
Rate by Counties (95)
Compared to TN avg ($199)
County Insight
Shelby County stands apart from the rest of Tennessee, its Memphis-driven costs creating a clear two-tier state. Tipton and Fayette counties in the greater Memphis area follow in the high tier. The northeast Tennessee counties — Washington, Carter and Sullivan — are the most affordable, a consistent pattern reflecting the region's lower litigation activity and stable Appalachian demographics.
What Every Tennessee Driver Needs To Know
What are the minimum car insurance requirements in TN for 2026?
Tennessee requires 25/50/15 minimums: $25,000 bodily injury per person, $50,000 per accident and $15,000 for property damage. Tennessee is an at-fault state — the driver who causes the crash bears financial responsibility for damages.
Does Tennessee require Uninsured Motorist coverage?
No, UM/UIM is optional in Tennessee, but insurers must offer it. Tennessee has one of the highest rates of uninsured drivers in the country, hovering near 20%. Without UM coverage, if an uninsured driver totals your car or injures you, you bear those costs alone unless you sue the driver personally — often an impractical option.
How does Tennessee handle accidents when both drivers share fault?
Tennessee follows a 'modified comparative fault' rule with a 50% bar. If you are found 49% or less at fault for an accident, you can still recover damages from the other driver, but your compensation is reduced by your percentage of fault. If you are 50% or more at fault, you recover nothing.
What are the consequences of driving uninsured in Tennessee?
A first offense for driving without insurance in Tennessee results in a fine of up to $100 plus court costs, but courts may also suspend your license. Subsequent offenses carry higher fines and mandatory license suspension. Tennessee also maintains an electronic insurance verification system — your insurer notifies the state when a policy lapses, which can trigger an automatic registration flag.
Sources: TN Driver Services