Ranked #15 of 51 by Cost
2026 Missouri Car Insurance Calculator
Estimate your monthly premium based on The Show-Me State averages

Rate Calculator
Local insurance tip
Missouri does not require Uninsured Motorist coverage, but the state has a persistently high uninsured driver rate estimated above 16%. Adding UM at modest cost is one of the highest-value optional coverages available to Missouri drivers, particularly in the St. Louis and Kansas City metros.
Cost Breakdown
| Coverage | Monthly | Description |
|---|---|---|
| MO minimum | $115 | Legal bare minimum (liability only) |
| Standard liability | $183 | High Liability, no physical damage |
| Full coverage | $244 | Comprehensive ($500 ded.) |
| Premium protection | $332 | Max liability ($250 ded.) |
| Age | Risk | Monthly |
|---|---|---|
| 16-19 | Very high | $720 |
| 20-24 | High | $403 |
| 25-54 | Standard | $244 |
| 55-69 | Low | $232 |
| 70+ | Moderate | $305 |
| Violation | Risk | Monthly |
|---|---|---|
| Clean | Standard | $244 |
| Speeding Ticket | Moderate | $298 |
| At-Fault Accident | High | $361 |
| DUI / DWI | Very high | $695 |
Missouri Snapshot · July 2026
$244/mo
State avg (-0% US AVG)
#15
National Rank
68%
County Spread
Rate by Neighboring States (9)
State Insight
Missouri sits in the mid-to-high tier among its neighbors. Illinois is the most expensive neighbor, its Cook County costs pulling it above Missouri. Kentucky is the next most expensive. Iowa and Nebraska are the most affordable neighbors by a clear margin, both well below Missouri's litigation-driven average.
Rate by Cities (Top 25)
Compared to MO avg ($244)
City Insight
St. Louis leads Missouri in premiums. High vehicle theft rates in the metro area, significant uninsured driver exposure and an active litigation environment in St. Louis City (an independent city separate from St. Louis County) combine to push rates well above the state average.
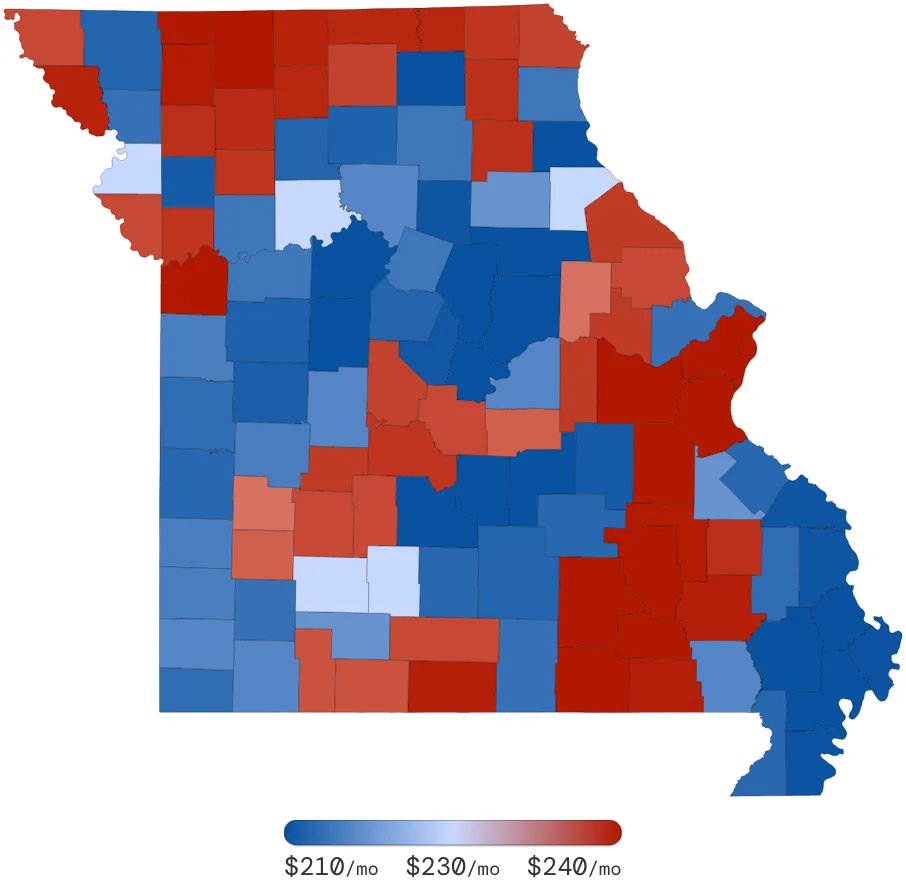
Rate by Counties (115)
Compared to MO avg ($244)
County Insight
St. Louis City stands apart from the rest of the state as an independent jurisdiction, and its rates reflect that isolation of urban risk. Jackson County anchors the Kansas City metro in the high tier. The Ozark counties in the south and the rural northeast counties are the most affordable, sitting well below the statewide average.
What Every Missouri Driver Needs To Know
What are the minimum car insurance requirements in MO for 2026?
Missouri requires 25/50/25 minimums: $25,000 bodily injury per person, $50,000 per accident and $25,000 for property damage. Missouri is an at-fault state. Uninsured Motorist coverage is offered but not mandated.
Why is St. Louis City rated separately from St. Louis County?
St. Louis City is a legal anomaly, it separated from St. Louis County in 1876 and has operated as an independent jurisdiction ever since. Insurers rate it as its own territory and its combination of high vehicle theft, urban density and litigation activity means drivers with a St. Louis City garaging address often pay significantly more than those just across the county line.
Does Missouri follow at-fault or no-fault rules?
Missouri is a pure at-fault state. The driver responsible for the accident pays for all resulting damages. Missouri also applies pure comparative fault — your recovery is reduced proportionally by your share of fault, but you are never fully barred from recovering even if you were mostly at fault.
What are the penalties for driving uninsured in Missouri?
A first offense for driving without insurance in Missouri results in a four-point license penalty, a fine and potential license suspension. Reinstatement requires proof of insurance and a fee. Missouri's point system means an uninsured driving conviction compounds any existing violations on your record, potentially triggering higher insurance surcharges for years.
Sources: Missouri DOR