#18 of 51 by Cost

2026 Illinois Car Insurance Calculator

Estimate your monthly premium based on The Land of Lincoln averages

Illinois state flag — 2026 car insurance rates

Rate Calculator

$222
per month
$2,664
per year
Updated July 1, 2026

Local insurance tip

Illinois allows insurers to use credit scores in pricing. Beyond credit, Chicago-area drivers can meaningfully reduce premiums by garaging their vehicle in a ZIP code outside the city limits, even a few miles can shift you into a significantly cheaper rating territory.

Cost Breakdown

Average Monthly Insurance Rate by Coverage Level
CoverageMonthlyDescription
IL minimum$104Legal bare minimum (liability only)
Standard liability$167High Liability, no physical damage
Full coverage$222Comprehensive ($500 ded.)
Premium protection$302Max liability ($250 ded.)
Average Monthly Insurance Rate by Age Group
AgeRiskMonthly
16-19Very high$655
20-24High$366
25-54Standard$222
55-69Low$211
70+Moderate$278
Average Monthly Insurance Rate by Driving History
ViolationRiskMonthly
CleanStandard$222
Speeding TicketModerate$271
At-Fault AccidentHigh$329
DUI / DWIVery high$633

Illinois Snapshot · July 2026

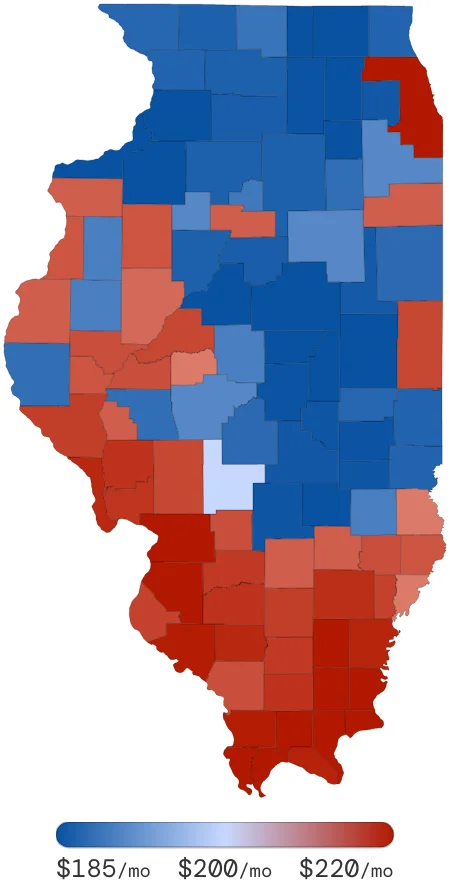
Illinois Car Insurance Rates by County July 2026

$222/mo

State avg (-9% US AVG)

#18

National Rank

56%

County Spread

Rate by Neighboring States (6)

Average Monthly Insurance Rate by State
RankStateMonthly Population
1Missouri$244+10%5,966,427
2Kentucky$238+7%4,304,801
3Illinois$22212,803,154
4Wisconsin$184-17%5,676,130
5Iowa$182-18%3,033,961
6Indiana$163-27%6,453,265

State Insight

Illinois is the most expensive of its neighbors. Kentucky and Missouri are the next most expensive, both pulled up by urban litigation environments. Indiana is the most affordable neighbor by a clear margin, its lower litigation activity keeping it well below Illinois despite sharing a long border and similar demographics.

Rate by Cities (Top 50)

Average Monthly Insurance Rate by City
RankCityMonthly Population
1East St. Louis$298+34%58,304
2Chicago$292+32%2,680,484
3Cicero$278+25%84,573
4Granite City$255+15%43,735
5Oak Park$254+14%51,878
6Melrose Park$254+14%47,480
7Berwyn$252+14%63,448
8Chicago Heights$247+11%58,136
9Skokie$236+6%60,240
10Belleville$234+5%95,666
11Oak Lawn$232+5%56,855
12Evanston$228+3%79,009
13Des Plaines$212-5%89,789
14Tinley Park$209-6%65,089
15Glenview$207-7%52,440
16Danville$207-7%45,744
17Springfield$203-9%140,742
18Orland Park$203-9%64,769
19Rockford$200-10%189,076
20Mount Prospect$200-10%55,219
21Joliet$199-10%128,354
22Hoffman Estates$199-10%50,190
23Waukegan$198-11%98,692
24Bolingbrook$197-11%73,374
25Arlington Heights$195-12%79,890
26Plainfield$193-13%94,521
27Schaumburg$193-13%75,951
28Quincy$193-13%51,810
29Aurora$192-14%206,095
30Peoria$192-14%135,657
31Elmhurst$190-14%46,371
32Decatur$187-16%86,556
33Palatine$187-16%77,570
34Round Lake$187-16%60,002
35Wheaton$186-16%59,488
36Lombard$186-16%51,468
37DeKalb$186-16%46,272
38Elgin$185-17%117,295
39Downers Grove$185-17%56,587
40Naperville$184-17%160,668
41Barrington$184-17%44,095
42Mchenry$180-19%56,812
43Champaign$177-20%88,746
44Saint Charles$176-21%56,316
45Pekin$176-21%43,810
46Crystal Lake$175-21%59,670
47Urbana$173-22%49,989
48Moline$172-23%45,099
49Bloomington$165-26%84,349
50Normal$162-27%52,879

Compared to IL avg ($222)

City Insight

Chicago and East Saint Louis sit at the top of the state by a significant margin. East Saint Louis is notable, a small city that rivals Chicago in rate, driven by its position on the Missouri border where cross-state litigation exposure from one of Illinois's most active plaintiff corridors compounds local economic conditions.

Rate by Counties (102)

Average Monthly Insurance Rate by County
RankCountyMonthly Population
1Cook$262+18%5,137,478
2St. Clair$240+8%258,966
3Madison$231+4%273,349
4Hardin$231+4%4,441
5Pope$230+4%3,326
6Pulaski$228+3%6,419
7Johnson$227+2%13,191
8Alexander$225+1%8,175
9Saline$22225,440
10Hamilton$2217,731
11Gallatin$2215,720
12Randolph$219-1%36,689
13Union$219-1%17,272
14Massac$217-2%15,295
15White$216-3%15,768
16Calhoun$215-3%4,756
17Perry$215-3%21,048
18Wayne$213-4%16,014
19Greene$212-5%14,302
20Washington$212-5%13,872
21Williamson$212-5%61,991
22Jersey$211-5%18,493
23Clinton$210-5%32,324
24Franklin$210-5%41,360
25Pike$209-6%16,702
26Jefferson$209-6%38,373
27Monroe$208-6%32,246
28Edwards$208-6%5,892
29Vermilion$207-7%81,844
30Mason$207-7%16,745
31Macoupin$207-7%51,258
32Schuyler$206-7%7,159
33Bond$206-7%18,981
34Richland$206-7%16,327
35Cass$206-7%14,355
36Jackson$206-7%62,850
37Knox$205-8%52,600
38Henderson$205-8%6,638
39Brown$205-8%6,902
40Lawrence$205-8%16,679
41Kankakee$204-8%114,838
42Mercer$204-8%15,528
43Marshall$204-8%11,954
44Hancock$204-8%19,871
45Clay$204-8%13,487
46Scott$204-8%4,854
47Marion$204-8%46,648
48Fulton$203-9%37,590
49Wabash$202-9%11,638
50Crawford$202-9%20,317
51Menard$202-9%12,757
52Montgomery$201-9%30,704
53Will$199-10%677,032
54Livingston$199-10%36,387
55Stark$199-10%6,334
56Sangamon$199-10%195,944
57McDonough$198-11%32,236
58Warren$198-11%17,683
59Logan$198-11%30,029
60Jasper$198-11%9,028
61Putnam$197-11%6,113
62Winnebago$196-12%295,993
63Grundy$195-12%51,030
64Adams$195-12%66,895
65Morgan$195-12%35,451
66Iroquois$194-13%28,182
67Christian$194-13%34,498
68Jo Daviess$193-13%22,395
69Douglas$193-13%22,719
70Lake$192-14%711,623
71Carroll$192-14%15,866
72Edgar$192-14%18,139
73Clark$192-14%17,093
74Ogle$191-14%51,683
75LaSalle$191-14%114,918
76Stephenson$191-14%48,802
77Bureau$191-14%34,453
78Peoria$191-14%186,407
79Lee$190-14%36,665
80Woodford$190-14%34,664
81Ford$189-15%13,989
82DuPage$188-15%947,346
83Shelby$188-15%21,884
84Moultrie$187-16%13,628
85Fayette$187-16%22,325
86Cumberland$187-16%10,960
87DeKalb$186-16%106,105
88Macon$186-16%109,261
89Coles$186-16%53,555
90Kane$185-17%504,818
91Kendall$185-17%102,515
92Boone$185-17%51,941
93Henry$182-18%49,417
94Whiteside$181-18%59,747
95De Witt$181-18%16,456
96Effingham$181-18%34,343
97McHenry$180-19%333,345
98Tazewell$180-19%137,288
99Piatt$179-19%15,923
100Rock Island$177-20%148,756
101Champaign$176-21%201,341
102McLean$168-24%170,792

Compared to IL avg ($222)

County Insight

Cook County drives the statewide average almost single-handedly, remove it and Illinois would look like a much more affordable state. St. Clair County in the Metro East is the second most expensive, its proximity to St. Louis's litigation environment pushing it well above neighboring downstate counties. McLean County is among the most affordable, anchored by Bloomington's unique demographic as home to major insurance carriers.

What Every Illinois Driver Needs To Know

What are the minimum car insurance requirements in IL for 2026?

Illinois requires 25/50/20 minimums: $25,000 bodily injury per person, $50,000 per accident and $20,000 for property damage. Illinois is an at-fault state and does not require PIP, though Uninsured Motorist coverage at matching limits is mandatory.

Does Illinois require Uninsured Motorist coverage?

Yes, Illinois mandates UM coverage at limits equal to your liability coverage. This is particularly important in Chicago, where uninsured driver rates in certain ZIP codes are estimated well above the state average. Your UM coverage steps in when the at-fault driver has no insurance or flees the scene.

Why is Chicago car insurance so much more expensive than the rest of Illinois?

Chicago consistently ranks among the top cities nationally for catalytic converter theft and vehicle theft overall. Combined with heavy traffic volume on the I-90, I-94 and I-290 corridors, high medical costs and an active plaintiff litigation bar. Cook County insurers face significantly higher claim costs than anywhere else in the state, and those costs are reflected in premiums.

What are the penalties for a coverage lapse in Illinois?

Illinois monitors insurance electronically and requires continuous coverage. A lapse can result in a fine of $500–$1,000, vehicle registration suspension and a $100 reinstatement fee. Driving on a suspended registration compounds the penalties. Repeat offenders may be required to file an SR-22 for three years.

Sources: Illinois DMV