Ranked #1 of 51 by Cost
2026 New York Car Insurance Calculator
Estimate your monthly premium based on The Empire State averages

Rate Calculator
Local insurance tip
In New York, your credit score is a major factor in your rate. Improving your score by even 50 points can sometimes lower your premium more than having a clean driving record for three years.
Cost Breakdown
| Coverage | Monthly | Description |
|---|---|---|
| NY minimum | $204 | Legal bare minimum (liability only) |
| Standard liability | $326 | High Liability, no physical damage |
| Full coverage | $434 | Comprehensive ($500 ded.) |
| Premium protection | $590 | Max liability ($250 ded.) |
| Age | Risk | Monthly |
|---|---|---|
| 16-19 | Very high | $1,280 |
| 20-24 | High | $716 |
| 25-54 | Standard | $434 |
| 55-69 | Low | $412 |
| 70+ | Moderate | $543 |
| Violation | Risk | Monthly |
|---|---|---|
| Clean | Standard | $434 |
| Speeding Ticket | Moderate | $529 |
| At-Fault Accident | High | $642 |
| DUI / DWI | Very high | $1,237 |
New York Snapshot · July 2026
$434/mo
State avg (+77% US AVG)
#1
National Rank
392%
County Spread
Rate by Neighboring States (6)
State Insight
New York is the most expensive of its neighbors by a significant margin. New Jersey is the second most expensive but still meaningfully cheaper than New York. Massachusetts and Connecticut are both well below New York despite being considered expensive states. Vermont is the most affordable neighbor by a dramatic margin, its rural character keeping it closer to the upstate New York market than to anything in the five boroughs.
Rate by Cities (Top 50)
Compared to NY avg ($434)
City Insight
Brooklyn car insurance is the most expensive in the nation for 2026, driven by extreme population density, a 15% spike in motor vehicle theft and a No-Fault system where 90% of medical fraud claims are linked to staged accidents.
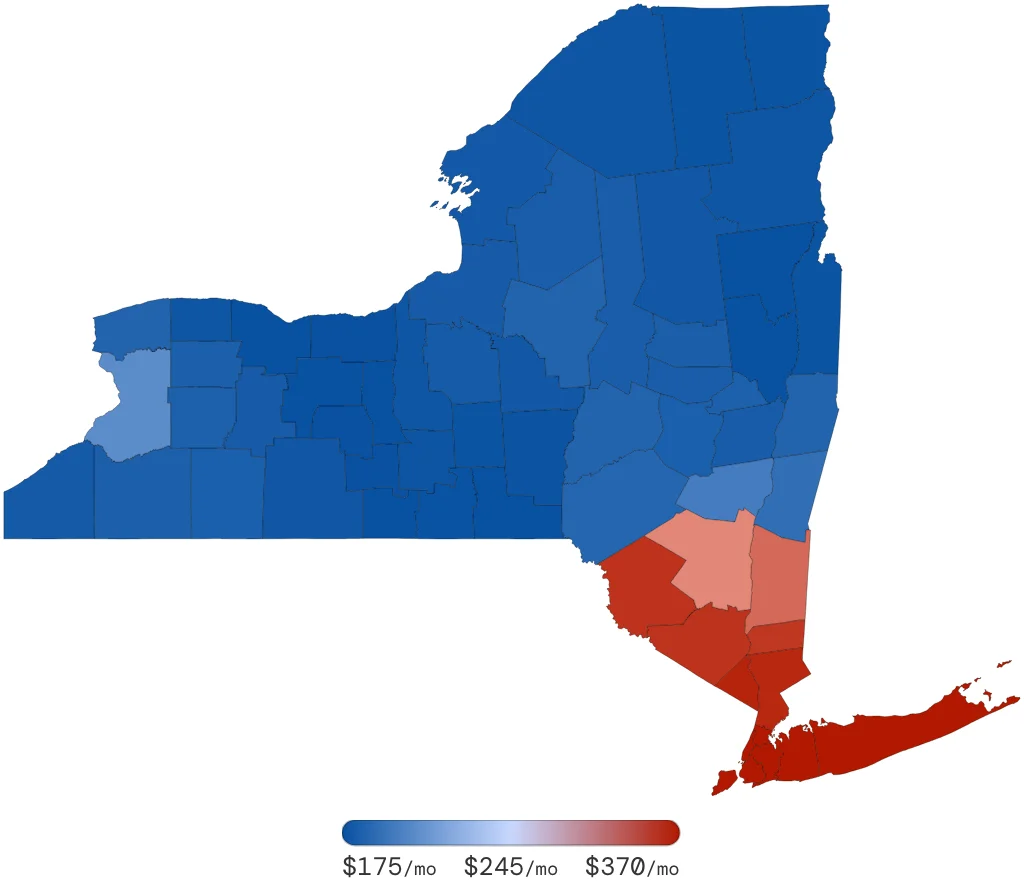
Rate by Counties (62)
Compared to NY avg ($434)
County Insight
Remove New York City entirely and New York would be one of the more affordable states in the Northeast. Saratoga, Warren and Monroe counties all sit well below the national average. The five boroughs pull the statewide figure upward more dramatically than almost any metro does in any other state.
What Every NY Driver Needs To Know
What is the Serious Injury Threshold in New York?
Because NY is a No-Fault state, you can only sue an at-fault driver for pain and suffering if your injury meets a specific legal threshold. This includes fractures, dismemberment, significant disfigurement, or an injury that prevents you from performing daily tasks for 90 of the 180 days following the accident.
How did the 2026 DMV point system change affect my insurance?
As of February 2026, the NY DMV lowered the suspension threshold to 10 points and extended the look-back period to 24 months. Insurers now have a longer window to view your violations, meaning a ticket from two years ago can still trigger a Driver Responsibility Assessment fee and a significant premium hike.
Is $50,000 in PIP enough for a driver in NYC?
While $50,000 is the legal minimum for Personal Injury Protection (PIP), a single ER visit in the NYC metro area in 2026 can quickly exhaust that limit. Many drivers opt for Additional PIP to protect themselves against high medical inflation and lost wages that exceed the basic $2,000 per month cap.
Why are New York rates rising so sharply in 2026?
New York currently ranks as the 4th most expensive state for insurance. Rates are climbing due to Nuclear Verdicts in state courts, a 15% rise in vehicle theft in urban hubs and the rising cost of high-tech sensors (ADAMS) in modern bumpers which have doubled the average repair bill since 2024.
Sources: New York DMV