Ranked #16 of 51 by Cost
2026 Kentucky Car Insurance Calculator
Estimate your monthly premium based on The Bluegrass State averages

Rate Calculator
Local insurance tip
Kentucky is a 'choice no-fault' state. You can opt out of the PIP no-fault system at policy signing. Opting out removes the PIP premium but means you can sue and be sued from dollar one. Review which system fits your health coverage before choosing.
Cost Breakdown
| Coverage | Monthly | Description |
|---|---|---|
| KY minimum | $112 | Legal bare minimum (liability only) |
| Standard liability | $179 | High Liability, no physical damage |
| Full coverage | $238 | Comprehensive ($500 ded.) |
| Premium protection | $324 | Max liability ($250 ded.) |
| Age | Risk | Monthly |
|---|---|---|
| 16-19 | Very high | $702 |
| 20-24 | High | $393 |
| 25-54 | Standard | $238 |
| 55-69 | Low | $226 |
| 70+ | Moderate | $298 |
| Violation | Risk | Monthly |
|---|---|---|
| Clean | Standard | $238 |
| Speeding Ticket | Moderate | $290 |
| At-Fault Accident | High | $352 |
| DUI / DWI | Very high | $678 |
Kentucky Snapshot · July 2026
$238/mo
State avg (-3% US AVG)
#16
National Rank
68%
County Spread
Rate by Neighboring States (8)
State Insight
Kentucky is more expensive than most of its neighbors. Ohio and Indiana are both significantly cheaper, their lower litigation activity and lack of a mandatory PIP requirement keeping them well below Kentucky. Tennessee is moderately cheaper. Illinois and Missouri sit above Kentucky, pulled up by their respective urban litigation environments.
Rate by Cities (Top 20)
Compared to KY avg ($238)
City Insight
Louisville consistently posts the state's highest premiums. Driven by dense interstate interchanges, high litigation activity in Jefferson County and one of Kentucky's highest vehicle theft rates.
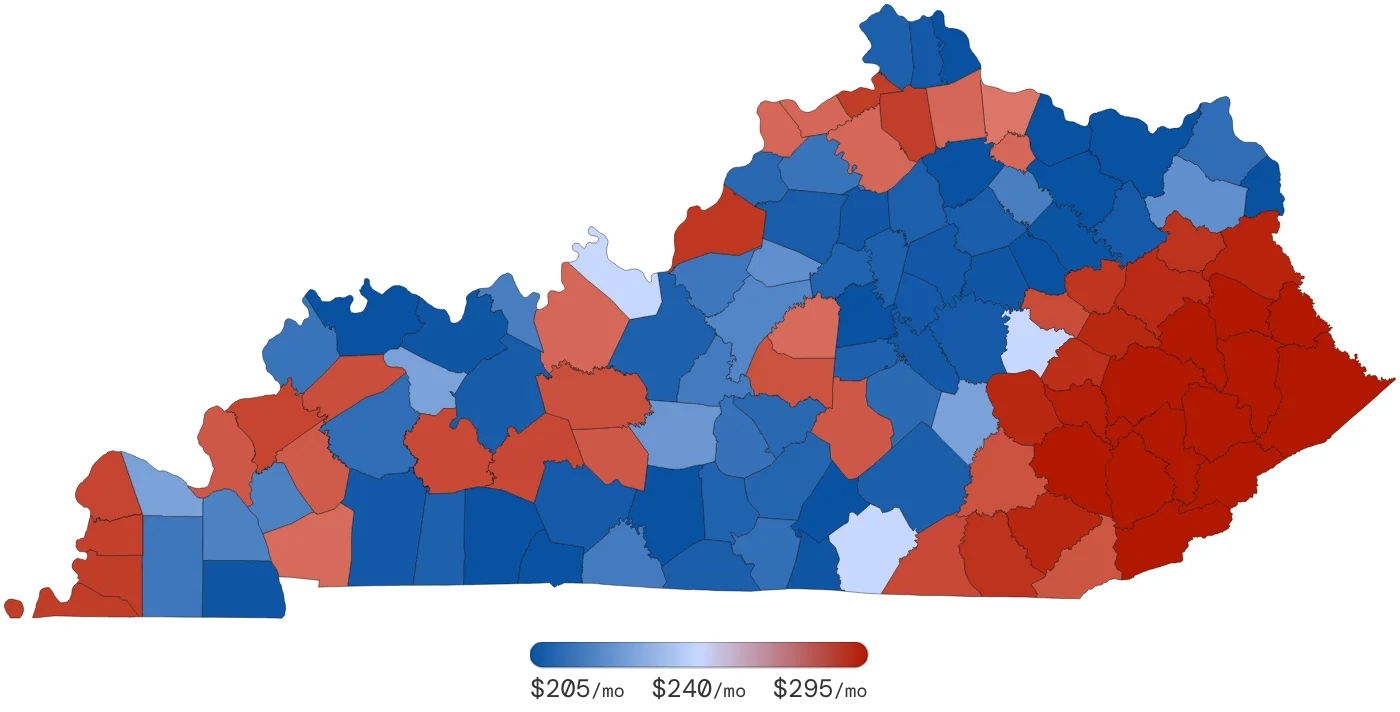
Rate by Counties (120)
Compared to KY avg ($238)
County Insight
The eastern coal country counties form a distinct high-rate tier that stands apart from the rest of the state. Knott, Perry, Floyd and Letcher counties sit dramatically above Louisville, driven by a combination of difficult road conditions, higher claim frequency and an active litigation environment in Kentucky's Appalachian region. The Bluegrass counties around Lexington are among the most affordable in the state.
What Every Kentucky Driver Needs To Know
What are the minimum car insurance requirements in KY for 2026?
Kentucky requires 25/50/25 minimums: $25,000 bodily injury per person, $50,000 per accident and $25,000 for property damage. Because Kentucky is a no-fault state by default, you are also required to carry $10,000 in Personal Injury Protection (PIP).
What does it mean that Kentucky is a 'choice no-fault' state?
When you purchase a policy in Kentucky, you can sign a form to reject the no-fault PIP system and operate under traditional tort rules instead. Under no-fault (the default), your own PIP pays your medical bills regardless of who caused the crash. Under tort, you can sue the at-fault driver immediately, but you can also be sued. Your choice is locked in for the policy term, so discuss it with your agent.
Can I reject PIP coverage to lower my premium in Kentucky?
Yes, opting out of no-fault removes the mandatory PIP premium, which can produce modest savings. However, it also removes your automatic $10,000 medical safety net. This tradeoff makes sense primarily if you have robust health insurance that covers auto accident injuries without a gap or subrogation clause.
What happens if I drive uninsured in Kentucky?
Kentucky uses an electronic insurance verification system tied to vehicle registration. Driving without insurance can result in a fine of $500–$1,000 for a first offense, license and registration suspension and a reinstatement fee. Repeat offenses carry escalating fines and may require SR-22 filing for up to three years.
Sources: KY Transportation Cabinet